50+ Mobile Phone Usage Statistics,Facts and Trends(2024)
Recent data unveils that the typical individual dedicates approximately 3 hours and 15 minutes daily to their smartphone, with a noteworthy 1 in 5 smartphone users investing more than 4.5 hours per day in this digital engagement.
This article presents some fascinating statistics that relates to phone usage around the world. Let's dive in.
Table of Contents
- GENERAL PHONE USAGE FACTS AND STATISTICS
- What is the average phone usage per day?
- How often do phone users touch their phone per day
- What is the statistic of cellphone subscribers by country
- Statistics for phone screen time by country
- What age group uses smartphones the most?
- What percentage of the population own smartphones
- What's the number of smartphones in the world
- Phone usage statistics based by gender
- Statistics on mobile app usage
- Which age group uses mobile app the most?
- Time Spent Per Day on App Category
- Wrap Up
- Sources
GENERAL PHONE USAGE FACTS AND STATISTICS
Phone Usage Per Day:
- Global average daily smartphone usage: 3 hours and 43 minutes.
- 1 in 5 smartphone users spend over 4.5 hours daily.
Screen Time Statistics:
- Daily screen time surge: 13% since 2013.
- Global average: 40% of waking hours on screens.
- Mobile screen time increase: 30% from 2019 to 2021.
Smartphone Ownership by Age:
- 18-29 age group: 96% ownership.
- 30-49 age group: 92% ownership.
- 50-64 age group: 79% ownership.
- 65 and above: 53% ownership.
Smartphone Market Penetration Rates:
- India: 27.70% penetration.
- UK: 82.20% penetration.
- South Korea: 95% penetration.
Global Smartphone Growth Rate:
- Projected users in 2024: 7.1 billion (85% of the world's population).
- 4.2% increase from 2022's 6.6 billion users.
- Annual growth rate (2016-2023): 9.5%.
- Forecasted users by 2027: 7.7 billion.
Mobile Phone App Usage:
- Average daily smartphone usage: 3 hours and 10 minutes.
- App usage: 90% of daily smartphone interaction.
- Over 80 applications installed on the typical smartphone.
Mobile Phone App Usage by Age:
- 18-24 age group: Elevated engagement, surpassing other age brackets in specific categories.
- Mobile App Category Time Spent:
Mobile Phone Usage Gender Gap:
- Global mobile phone gender gap: 10%.
- South Asia faces a 28% gap.
- Sub-Saharan Africa: 69% mobile ownership.
- East Asia and the Pacific:1% gender gap.
- Shrinking gender gap in Europe, Central Asia, Latin America, and the Caribbean.
What is the average phone usage per day?
Recent data unveils that the typical individual dedicates approximately 3 hours and 15 minutes daily to their smartphone, with a noteworthy 1 in 5 smartphone users investing more than 4.5 hours per day in this digital engagement.
Surprisingly, weekdays witness a higher average of smartphone utilization compared to weekends. A striking 58 daily phone checks are the norm, and notably, almost 52% of these checks, totaling around 30 per day, unfold within the confines of the workday.
The habitual nature of phone interaction is evident, with half of all screen time sessions commencing within a mere 3 minutes of the last
How often do phone users touch their phone per day
Techmark reveals that the ordinary smartphone user glances at their device 221 times daily and interacts with it through over 2,000 touches.
What is the statistic of cellphone subscribers by country
- China dominates with 1.3 billion cell phones, leading the global count.
- India follows closely with 1.17 billion subscribers, anticipating smartphone growth.
- In the United States, 77% use smartphones, a significant surge since 2011.
- Brazil boasts 284 million subscribers, favoring Android devices.
- Russia, with 256 million users, features telecom giants MTS, Beeline and MegaFon.
Statistics for phone screen time by country
In a global phone screen time snapshot across 43 nations, South Africa leads with the highest daily average.
Following suit are the Philippines, Brazil, and Colombia, each exceeding 5 hours.
| Country | Durations |
| Argentina | (5h 4m) |
| Malaysia | (4h 47m) |
| Thailand | (5h 29m) |
| Mexico | (4h 27m) |
| Indonesia | (4h 56m) |
| UAE | (4h 35m) |
| Saudi Arabia | (4h 35m) |
| Taiwan | (4h 12m) |
In the grand scheme, daily screen time has surged by 13%, equivalent to 49 extra minutes, since 2013. Current statistics indicate that individuals dedicate over 40% of their waking hours to internet-connected screens.
Between 2022 and 2023, internet users in just four countries saw an increase in their average screen time, with the Netherlands leading the way:
- Netherlands (+16 minutes)
- China (+10 minutes)
- Russia (+7 minutes)
- Poland (+2 minutes)
The leap from 2019's mobile screen time (2h 56m) to 2021's (4h 12m) signals a 30% increase, pointing towards a probable continuation of the upward trajectory in global screen time averages.
The global average daily time spent on smartphones is 3 hours and 43 minutes.
What age group uses smartphones the most?
Phone ownership aligns with age demographics, evident in the US, where 18-29-year-olds boast a staggering 96% ownership rate, followed closely by the 30-49 age group at 92%.
The 50-64 demographic holds a solid 79%, while those aged 65 and above register at 53%. Across generations, the tech-savvy Gen Z and Millennials lead, closely trailed by Gen X and Boomers.
This trend remains consistent, whether in advanced economies like South Korea, Australia, or the US, or emerging ones such as Brazil, South Africa, or India.
What percentage of the population own smartphones
Regional variations and research samples delineate diverse smartphone penetration rates. Despite India's substantial population nearly rivaling China's, its penetration stands at 27.70%.
The UK and South Korea lead, boasting 82.20% and 95%, respectively. As of 2018, the global average hovered at 39%, with a projected uptick to 41.5% on the horizon.
What's the number of smartphones in the world
In 2024, projections foresee the global count of smartphone users hitting 7.1 billion, encompassing a staggering 85% of the world's populace.
This reflects a 4.2% uptick from the preceding year, with 6.6 billion users recorded in 2022. Over the span of 2016 to 2023, the global smartphone user base expanded at a steady annual rate of 9.5%.
Industry forecasts paint a picture of 7.7 billion smartphone users by the close of 2027.
Phone usage statistics based by gender
The global mobile phone gender gap hovers at 10%, a steady figure since 2017-2018, as per GSMA Intelligence's Mobile Gender Gap Report
In low- to medium-income nations, women are 10% less likely to own a phone, with South Asia facing a significant 28% gap. Sub-Saharan Africa follows at 69% ownership, leaving 81 million women unconnected.
Notably, East Asia and the Pacific boast a minimal 1% gender gap, while Europe and Central Asia flaunt a -2% gap.
Over the same period, the gender gap in Europe, Central Asia, Latin America, and the Caribbean shrunk by 50%, while the Middle East, North Africa, and South Asia witnessed varying growth percentages.
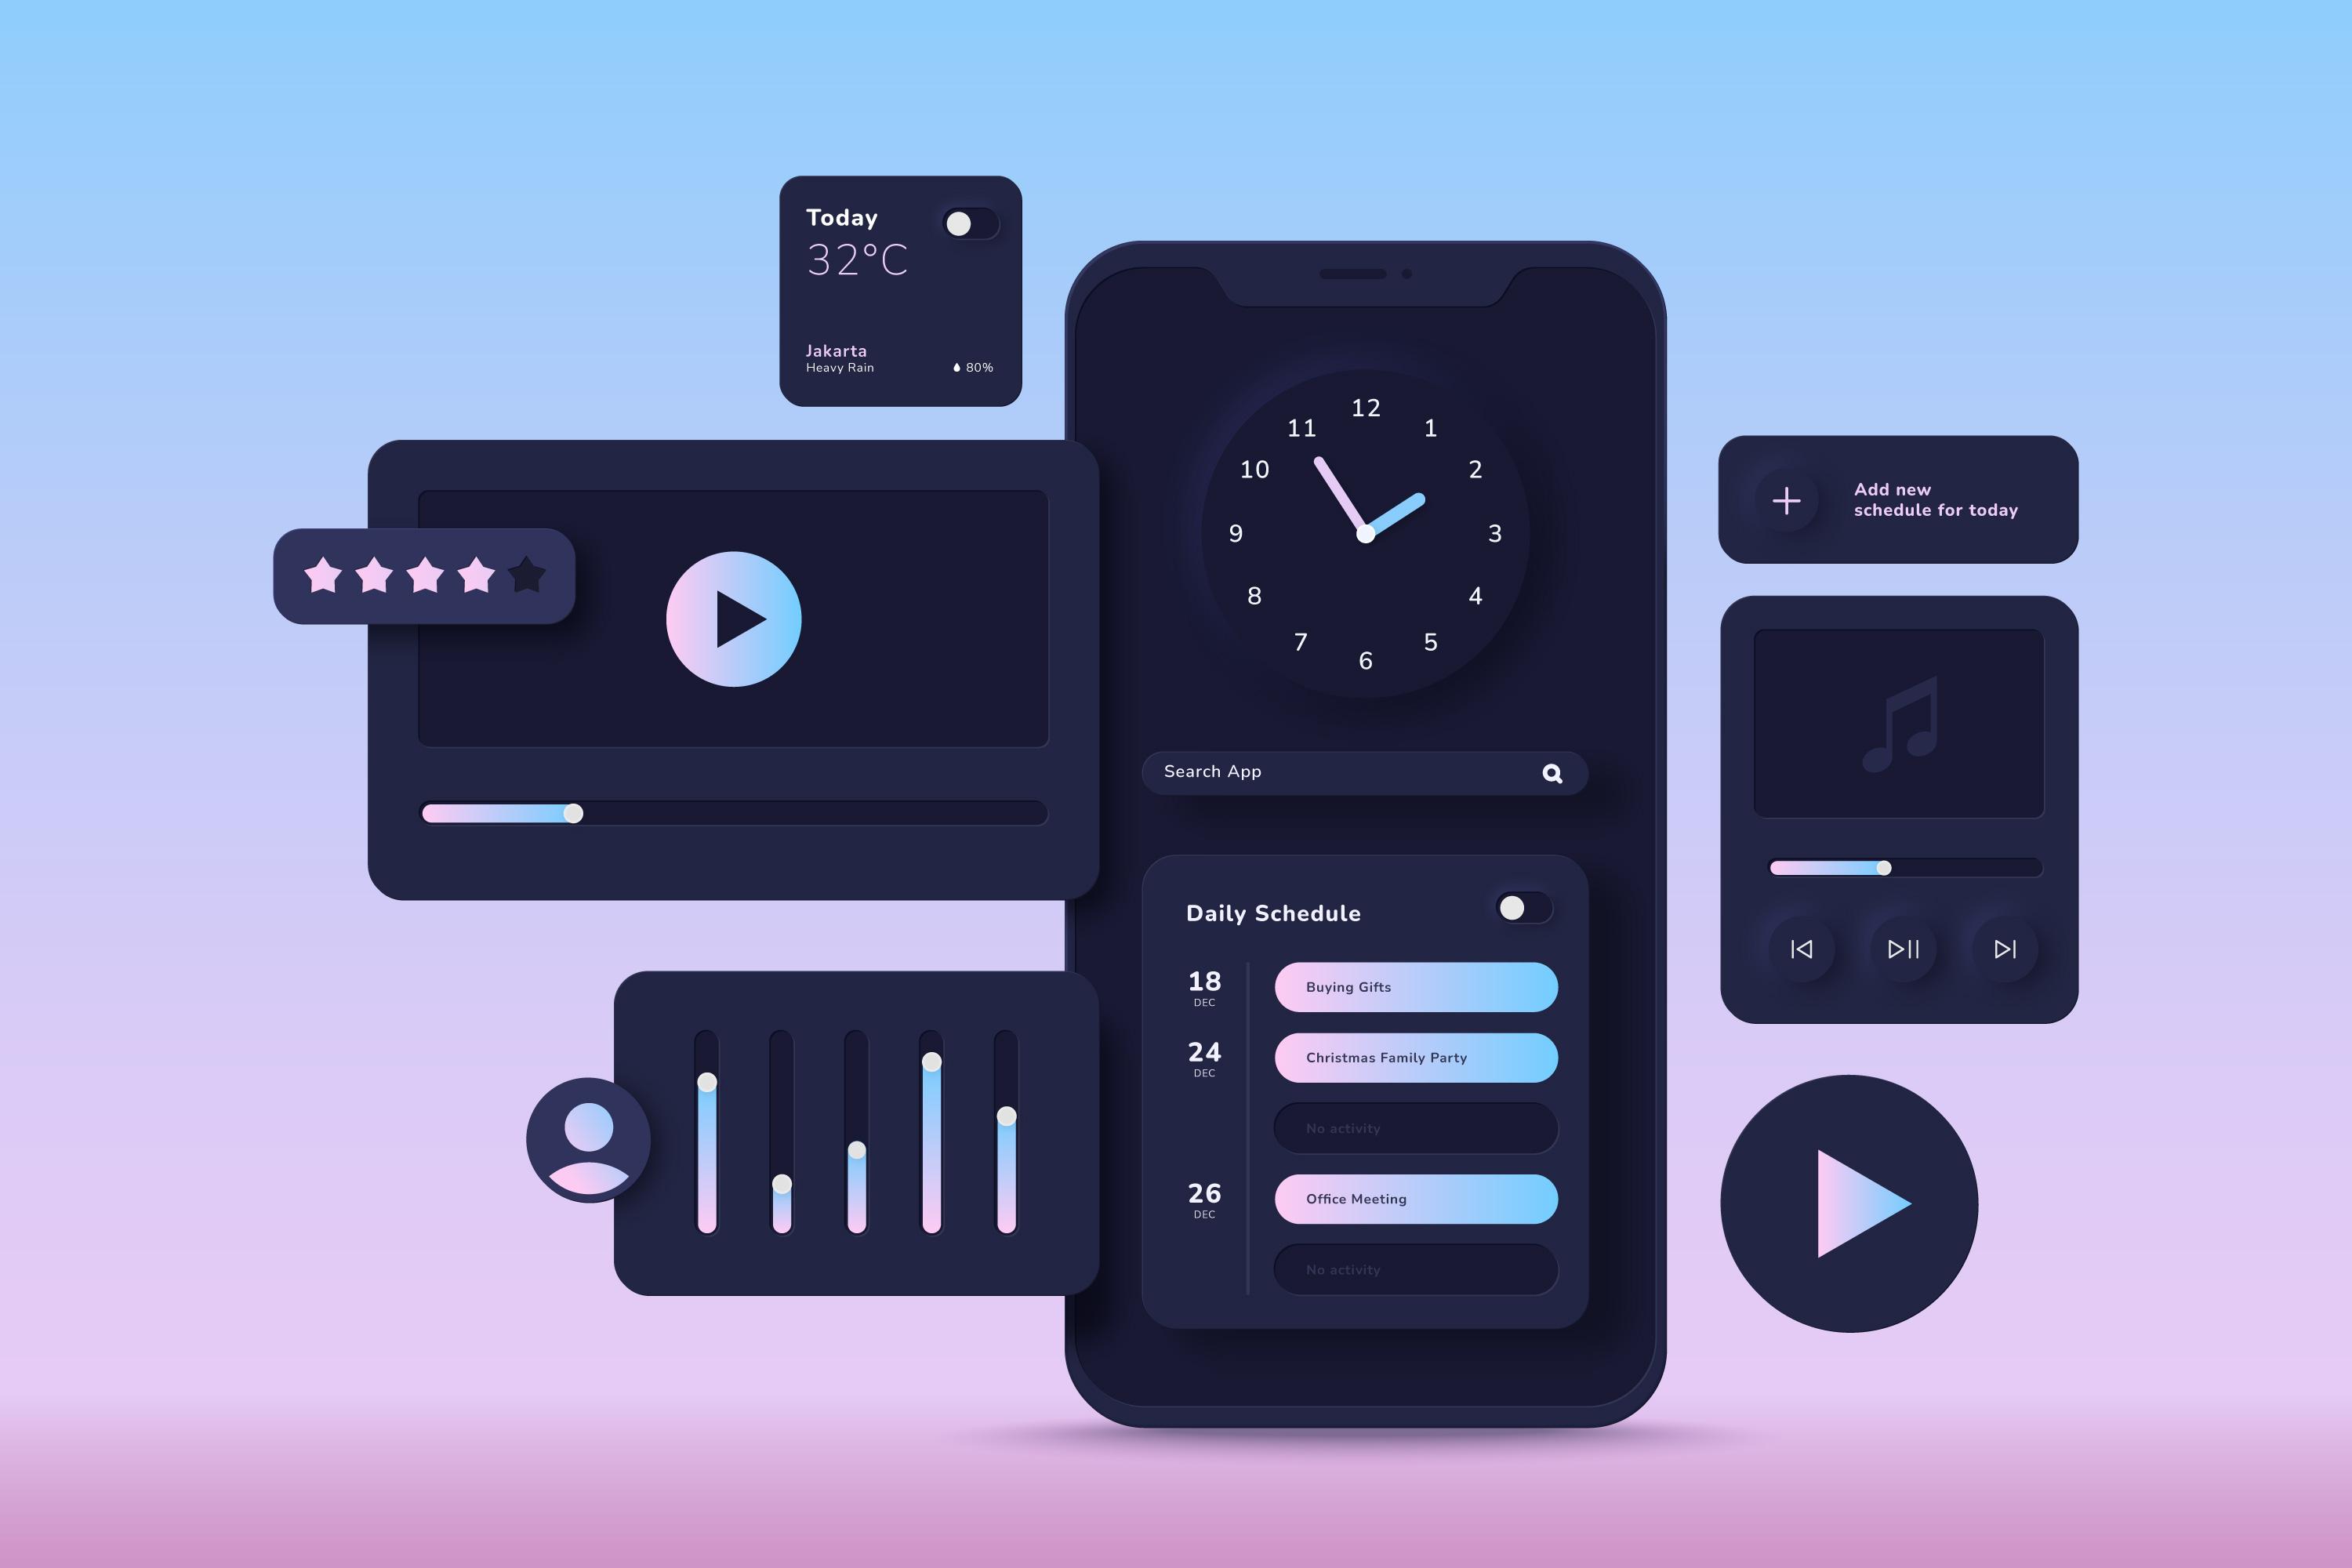
Statistics on mobile app usage
On an average day, smartphone users dedicate 3 hours and 10 minutes to their devices, with approximately 90% of this duration allocated to app engagement, totaling around 2 hours and 51 minutes.
Extensive research highlights the presence of over 80 applications installed on the typical smartphone, emphasizing the multifaceted nature of digital interactions in our daily lives.
Which age group uses mobile app the most?
The 18-24 age group exhibits a notably elevated app engagement compared to their older counterparts, displaying a penchant for various app categories on both iOS and Google Play platforms.
Remarkably, in specific app categories, the 18-24 demographic not only surpasses but outpaces the combined usage of all other age brackets, underscoring the distinctive digital preferences and behaviors of this dynamic age cohort.
Time Spent Per Day on App Category
Social media apps dominate daily usage, averaging over 2 hours, establishing themselves as the most prevalent app category.
Following closely is music streaming, serving as a popular background companion during study or work sessions, with an average usage duration of 1.28 hours per day.
These trends underscore the prominent role of social connectivity and immersive audio experiences in the contemporary digital landscape.
Wrap Up
Global trends indicate significant smartphone penetration, with projected 7.1 billion users by 2024.
Age differentials impact ownership, with 18-29-year-olds leading at 96%. Mobile app usage dominates daily interactions, particularly social media and music streaming.
The global mobile gender gap stands at 10%, varying across regions. These statistics illuminate the dynamic landscape of digital behavior, reflecting diverse preferences, screen time habits, and smartphone connectivity worldwide.
Sources
Also read;
Brave Browser Usage Statistics
Centralized (CEX) vs Decentralized Exchange(DEX) Usage Statistics 2024